
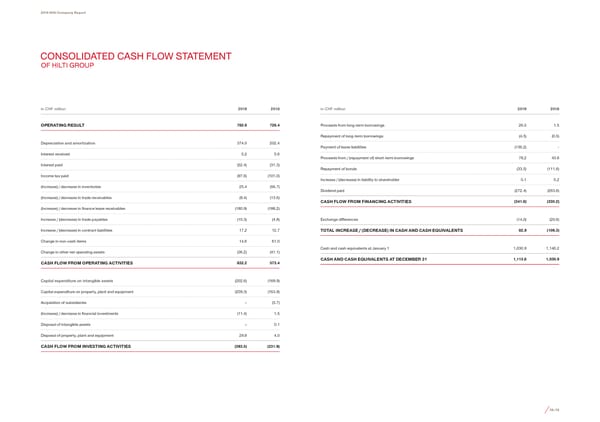
2019 Hilti Company Report CONSOLIDATED CASH FLOW STATEMENT OF HILTI GROUP 2019 2018 2019 2018 in CHF million in CHF million OPERATING RESULT 782.6 728.4 Proceeds from long-term borrowings 26.5 1.5 Repayment of long-term borrowings (4.5) (0.5) Depreciation and amortization 374.0 202.4 Payment of lease liabilities (136.2) - Interest received 5.2 5.6 Proceeds from / (repayment of) short-term borrowings 78,2 43.8 Interest paid (52.4) (31.3) Repayment of bonds (33.5) (111.6) Income tax paid (97.6) (101.0) Increase / (decrease) in liability to shareholder 0.1 0.2 (Increase) / decrease in inventories 25.4 (56.7) Dividend paid (272.4) (263.6) (Increase) / decrease in trade receivables (9.4) (13.6) CASH FLOW FROM FINANCING ACTIVITIES (341.8) (330.2) (Increase) / decrease in 昀椀nance lease receivables (180.9) (188.2) Increase / (decrease) in trade payables (10.3) (4.8) Exchange differences (14,0) (20.6) Increase / (decrease) in contract liabilities 17.2 12.7 TOTAL INCREASE / (DECREASE) IN CASH AND CASH EQUIVALENTS 82,9 (109.3) Change in non-cash items 14.6 61.0 Change in other net operating assets (36.2) (41.1) Cash and cash equivalents at January 1 1,030.9 1,140.2 CASH FLOW FROM OPERATING ACTIVITIES 832.2 573.4 CASH AND CASH EQUIVALENTS AT DECEMBER 31 1,113.8 1,030.9 Capital expenditure on intangible assets (202.6) (169.9) Capital expenditure on property, plant and equipment (209.3) (163.9) Acquisition of subsidiaries – (3.7) (Increase) / decrease in 昀椀nancial investments (11.4) 1.5 Disposal of intangible assets – 0.1 Disposal of property, plant and equipment 29.8 4.0 CASH FLOW FROM INVESTING ACTIVITIES (393.5) (331.9) 78–79
 2019 Company Report Page 42 Page 44