
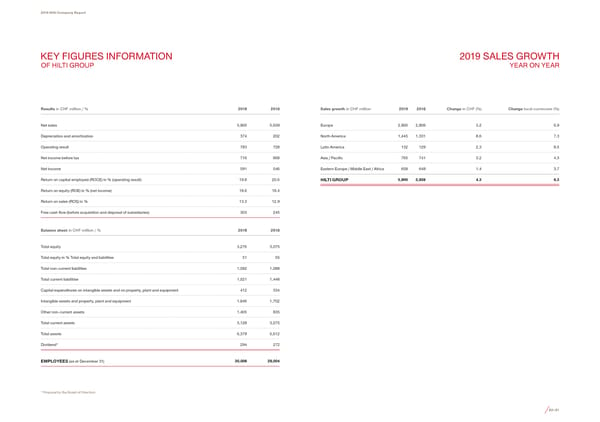
2019 Hilti Company Report KEY FIGURES INFORMATION 2019 SALES GROWTH OF HILTI GROUP YEAR ON YEAR Results in CHF million / % 2019 2018 Sales growth in CHF million 2019 2018 Change in CHF (%) Change local currencies (%) Net sales 5,900 5,659 Europe 2,900 2,809 3.2 6.9 Depreciation and amortization 374 202 North America 1,445 1,331 8.6 7.3 Operating result 783 728 Latin America 132 129 2.3 8.5 Net income before tax 716 668 Asia / Paci昀椀c 765 741 3.2 4.3 Net income 591 546 Eastern Europe / Middle East / Africa 658 649 1.4 3.7 Return on capital employed (ROCE) in % (operating result) 19.8 20.6 HILTI GROUP 5,900 5,659 4.3 6.3 Return on equity (ROE) in % (net income) 18.6 18.4 Return on sales (ROS) in % 13.3 12.9 Free cash 昀氀ow (before acquisition and disposal of subsidiaries) 303 245 2019 2018 Balance sheet in CHF million / % Total equity 3,276 3,075 Total equity in % Total equity and liabilities 51 55 Total non-current liabilities 1,582 1,088 Total current liabilities 1,521 1,448 Capital expenditures on intangible assets and on property, plant and equipment 412 334 Intangible assets and property, plant and equipment 1,846 1,702 Other non-current assets 1,405 835 Total current assets 3,128 3,075 Total assets 6,379 5,612 Dividend* 294 272 EMPLOYEES (as at December 31) 30,006 29,004 * Proposal by the Board of Directors 80–81
 2019 Company Report Page 43 Page 45