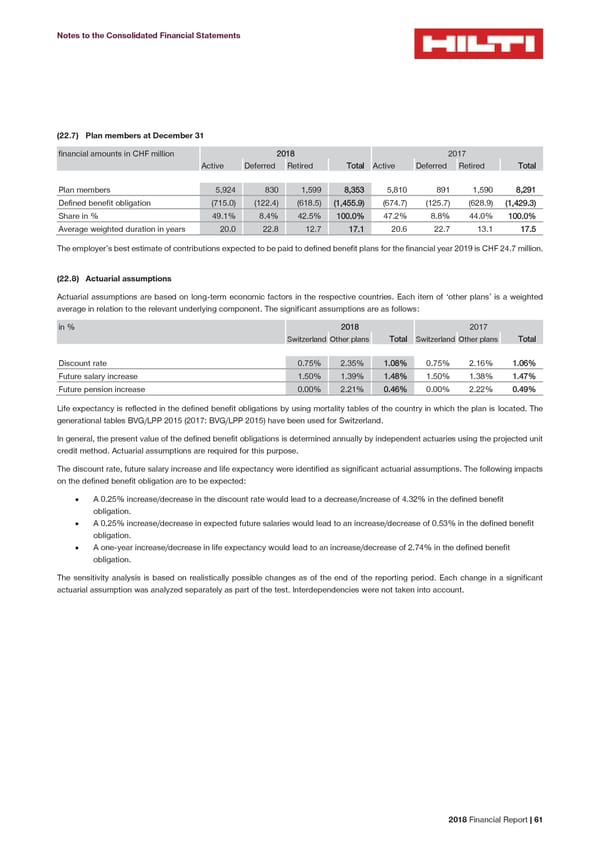
Notes to the Consolidated Financial Statements (22.7) Plan members at December 31 financial amounts in CHF million 2018 2017 Active Deferred Retired Total Active Deferred Retired Total Plan members 5,924 830 1,599 8,353 5,810 891 1,590 8,291 Defined benefit obligation (715.0) (122.4) (618.5) (1,455.9) (674.7) (125.7) (628.9) (1,429.3) Share in % 49.1% 8.4% 42.5% 100.0% 47.2% 8.8% 44.0% 100.0% Average weighted duration in years 20.0 22.8 12.7 17.1 20.6 22.7 13.1 17.5 The employer’s best estimate of contributions expected to be paid to defined benefit plans for the financial year 2019 is CHF 24.7 million. (22.8) Actuarial assumptions Actuarial assumptions are based on long-term economic factors in the respective countries. Each item of ‘other plans’ is a weighted average in relation to the relevant underlying component. The significant assumptions are as follows: in % 2018 2017 Switzerland Other plans Total Switzerland Other plans Total Discount rate 0.75% 2.35% 1.08% 0.75% 2.16% 1.06% Future salary increase 1.50% 1.39% 1.48% 1.50% 1.38% 1.47% Future pension increase 0.00% 2.21% 0.46% 0.00% 2.22% 0.49% Life expectancy is reflected in the defined benefit obligations by using mortality tables of the country in which the plan is located. The generational tables BVG/LPP 2015 (2017: BVG/LPP 2015) have been used for Switzerland. In general, the present value of the defined benefit obligations is determined annually by independent actuaries using the projected unit credit method. Actuarial assumptions are required for this purpose. The discount rate, future salary increase and life expectancy were identified as significant actuarial assumptions. The following impacts on the defined benefit obligation are to be expected: • A 0.25% increase/decrease in the discount rate would lead to a decrease/increase of 4.32% in the defined benefit obligation. • A 0.25% increase/decrease in expected future salaries would lead to an increase/decrease of 0.53% in the defined benefit obligation. • A one-year increase/decrease in life expectancy would lead to an increase/decrease of 2.74% in the defined benefit obligation. The sensitivity analysis is based on realistically possible changes as of the end of the reporting period. Each change in a significant actuarial assumption was analyzed separately as part of the test. Interdependencies were not taken into account. 2018 Financial Report | 61
 2018 Financial Report Page 62 Page 64