
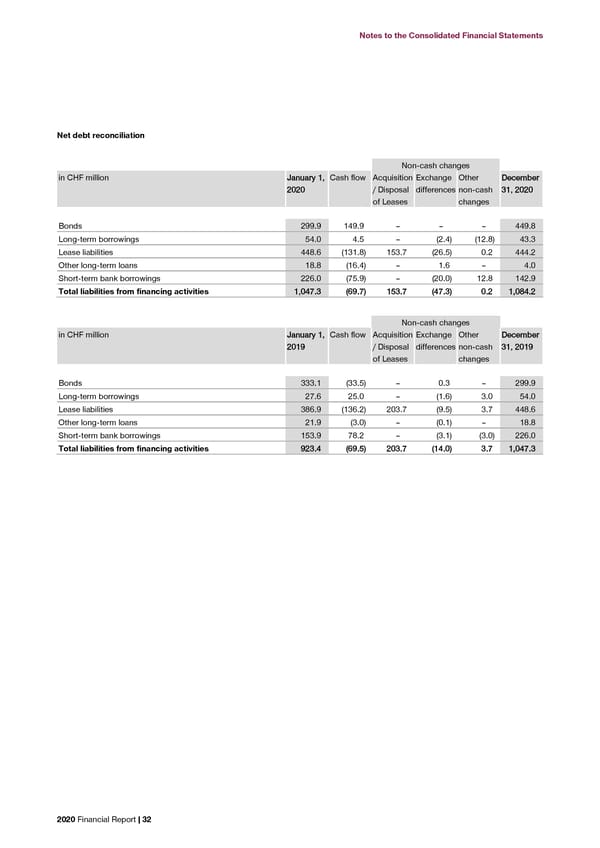
Notes to the Consolidated Financial Statements Notes to the Consolidated Financial Statements Net debt reconciliation (2.22) Capital structure risk The Group’s primary objective when managing capital is to add sustainable value for investors management while ensuring the independence of the Group. In order to maintain or adjust the capital Non-cash changes structure, the Group maintains a flexible dividend policy within the limits of its overall finance in CHF million JJaannuuaarryy 11,, Cash flow Acquisition Exchange Other DDeecceemmbbeerr policies. 22002200 / Disposal differences non-cash 3311,, 22002200 of Leases changes The Group monitors capital on the basis of the equity ratio measured as equity in percentage of total equity and liabilities. The Group views a high equity ratio as the basis for ensuring security, Bonds 299.9 149.9 – – – 449.8 capability of taking risk, independence, flexibility and creditworthiness. The Group’s objective is Long-term borrowings 54.0 4.5 – (2.4) (12.8) 43.3 to maintain a sufficiently high equity ratio primarily to ensure independence from the influence of Lease liabilities 448.6 (131.8) 153.7 (26.5) 0.2 444.2 external creditors as well as to maintain a high external credit rating to help minimize the cost of debt if and when further debt is issued. Other long-term loans 18.8 (16.4) – 1.6 – 4.0 Short-term bank borrowings 226.0 (75.9) – (20.0) 12.8 142.9 The Group’s policy is to maintain a minimum equity ratio of 45% on a mid-term basis. Following Total liabilities from financing activities 11,,004477..33 ((6699..77)) 115533..77 ((4477..33)) 00..22 11,,008844..22 is equity ratio information at the balance sheet date: in CHF million 22002200 2019 Non-cash changes Total equity 3,472.1 3,276.3 in CHF million JJaannuuaarryy 11,, Cash flow Acquisition Exchange Other DDeecceemmbbeerr Total equity and liabilities 6,546.0 6,379.1 22001199 / Disposal differences non-cash 3311,, 22001199 Total equity in % Total equity and liabilities 5533..00%% 5511..44%% of Leases changes Based on the Group’s credit profile and outlook as assessed by the Credit Suisse Banking Group Bonds 333.1 (33.5) – 0.3 – 299.9 during 2020 on the basis of the Group’s 2019 Financial Report a credit rating of ‘High A stable’ Long-term borrowings 27.6 25.0 – (1.6) 3.0 54.0 was assigned (2019: ‘High A stable’) (see Credit Suisse: Swiss Corporate Credit Handbook Lease liabilities 386.9 (136.2) 203.7 (9.5) 3.7 448.6 September 2020). Other long-term loans 21.9 (3.0) – (0.1) – 18.8 Short-term bank borrowings 153.9 78.2 – (3.1) (3.0) 226.0 Total liabilities from financing activities 992233..44 ((6699..55)) 220033..77 ((1144..00)) 33..77 11,,004477..33 (2.23) Fair value estimation The table below analyzes financial instruments carried at fair value, by valuation method. The different levels have been defined as follows: • Quoted prices (unadjusted) in active markets for identical assets or liabilities (level 1) • Inputs other than quoted prices included within level 1 that are observable for the asset or liability, either directly (that is, as prices) or indirectly (that is, derived from prices) (level 2) • Inputs for the asset or liability that are not based on observable market data (that is, unobservable inputs) (level 3). The following table presents the Group’s assets and liabilities that are measured at fair value: in CHF million Level 1 Level 2 Level 3 TToottaall At December 31, 2020 Assets Financial assets at fair value through profit and loss 23.8 – – 2233..88 Derivatives used for hedging – 10.3 – 1100..33 Liabilities Derivatives used for hedging – 6.7 – 66..77 2020 Financial Report | 32 2020 Financial Report | 33
 2020 Financial Report Page 33 Page 35