
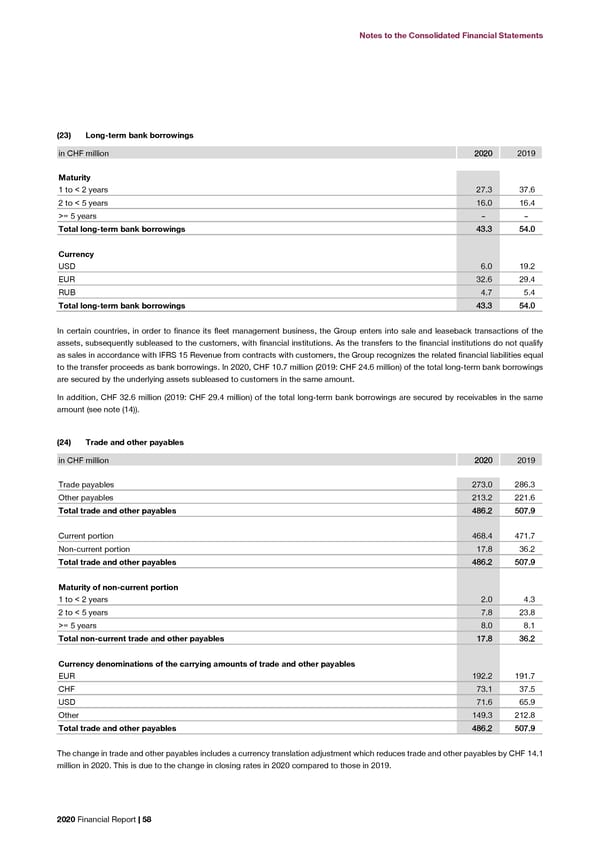
Notes to the Consolidated Financial Statements Notes to the Consolidated Financial Statements (23) Long-term bank borrowings Other payables primarily consist of liabilities for personnel expenses totaling CHF 9.2 million (2019: CHF 8.2 million), liabilities for social contributions totaling CHF 21.7 million (2019: CHF 33.5 million), liabilities for source-deducted taxes and VAT totaling CHF 104.9 million in CHF million 22002200 2019 (2019: CHF 88.8 million) and customers with credit balances totaling CHF 44.9 million (2019: CHF 36.7 million). Maturity 1 to < 2 years 27.3 37.6 (25) Accrued liabilities and deferred income 2 to < 5 years 16.0 16.4 >= 5 years – – Accrued liabilities and deferred income comprise short-term liabilities, which include estimates, short-term expense accruals and Total long-term bank borrowings 4433..33 5544..00 deferrals of income already received but attributable to subsequent accounting periods. Currency (26) Short-term bank borrowings USD 6.0 19.2 EUR 32.6 29.4 in CHF million 22002200 2019 RUB 4.7 5.4 Total long-term bank borrowings 4433..33 5544..00 Currency EUR 49.1 48.4 In certain countries, in order to finance its fleet management business, the Group enters into sale and leaseback transactions of the USD 25.5 88.6 assets, subsequently subleased to the customers, with financial institutions. As the transfers to the financial institutions do not qualify RUB 21.1 28.4 as sales in accordance with IFRS 15 Revenue from contracts with customers, the Group recognizes the related financial liabilities equal Other 47.2 60.6 to the transfer proceeds as bank borrowings. In 2020, CHF 10.7 million (2019: CHF 24.6 million) of the total long-term bank borrowings Total short-term bank borrowings 114422..99 222266..00 are secured by the underlying assets subleased to customers in the same amount. In 2020, CHF 11.9 million (2019: CHF 17.6 million) of the total short-term bank borrowings are secured by the underlying assets subleased In addition, CHF 32.6 million (2019: CHF 29.4 million) of the total long-term bank borrowings are secured by receivables in the same to customers in the same amount (see note (23)). In addition, CHF 27.5 million (2019: CHF 30.9 million) of the total short-term bank amount (see note (14)). borrowings are secured by receivables in the same amount (see note (14)). (24) Trade and other payables (27) Operating income in CHF million 22002200 2019 Categories of operating revenues are as follows: Trade payables 273.0 286.3 in CHF million 22002200 2019 Other payables 213.2 221.6 Total trade and other payables 448866..22 550077..99 Net sales of goods 4,927.4 5,501.7 Net sales of services 404.8 398.2 Current portion 468.4 471.7 Total net sales 55,,333322..22 55,,889999..99 Non-current portion 17.8 36.2 Other operating revenues 149.4 154.9 Total trade and other payables 448866..22 550077..99 Total operating revenues 55,,448811..66 66,,005544..88 Maturity of non-current portion The above categories ‘net sales of goods’ and ‘net sales of services’ in terms of IFRS 15 ‘Revenue from Contract with Customers’ 1 to < 2 years 2.0 4.3 represent, respectively, revenue from sales of goods and revenue from rendering of services, such as logistics, repairs (including service 2 to < 5 years 7.8 23.8 warranty), tests and trainings. Other operating income, amongst others, consists of finance lease interests including related risk >= 5 years 8.0 8.1 premiums. Total non-current trade and other payables 1177..88 3366..22 A breakdown of net sales by geographical areas and by major countries is given in note (34). Currency denominations of the carrying amounts of trade and other payables The revenue recognized that was included in the contract liabilities balance at the beginning of the period totals CHF 111.8 million (2019: CHF 116.6 million). EUR 192.2 191.7 CHF 73.1 37.5 USD 71.6 65.9 Other 149.3 212.8 Total trade and other payables 448866..22 550077..99 The change in trade and other payables includes a currency translation adjustment which reduces trade and other payables by CHF 14.1 million in 2020. This is due to the change in closing rates in 2020 compared to those in 2019. 2020 Financial Report | 58 2020 Financial Report | 59
 2020 Financial Report Page 59 Page 61